Monitors
A Monitor watches one page (or a whole group of pages) on a schedule: it recaptures them automatically and compares each new screenshot against a baseline, notifying you when something changes. Monitors run unattended (never in your browser like a manual capture can), normally only against a Production environment. They run on VisualRunner's platform servers — unless that environment's Capture delivery is set to a Private Runner, in which case the monitor runs inside your own network instead (and a runner-delivered environment doesn't have to be Production).
Creating a monitor
| Field | What it means |
|---|---|
| Scope | Single page (the default — watches exactly one page) or Path prefix (watches every page whose path starts with a prefix, e.g. /blog). |
| Page | Shown for Single page scope: the one page this monitor watches. |
| Path prefix | Shown for Path prefix scope: pages the Scanner discovers under this prefix later are picked up automatically on the next run — no need to recreate the monitor. This means a path-prefix monitor's cost can grow over time; the Estimated usage panel calls this out explicitly rather than showing a fixed number. |
| Environment | Must be marked Production (see Environments); non-production and browser-only environments aren't offered here. |
| Languages / Viewports | Which language and viewport combinations to capture and compare each run. |
| Schedule | How often it runs — hourly, daily, weekly, or a custom cron expression. |
| Watched region (optional) | A CSS selector to scope captures to just one element instead of the full page, so sensitivity isn't diluted by unrelated changes elsewhere on the page. |
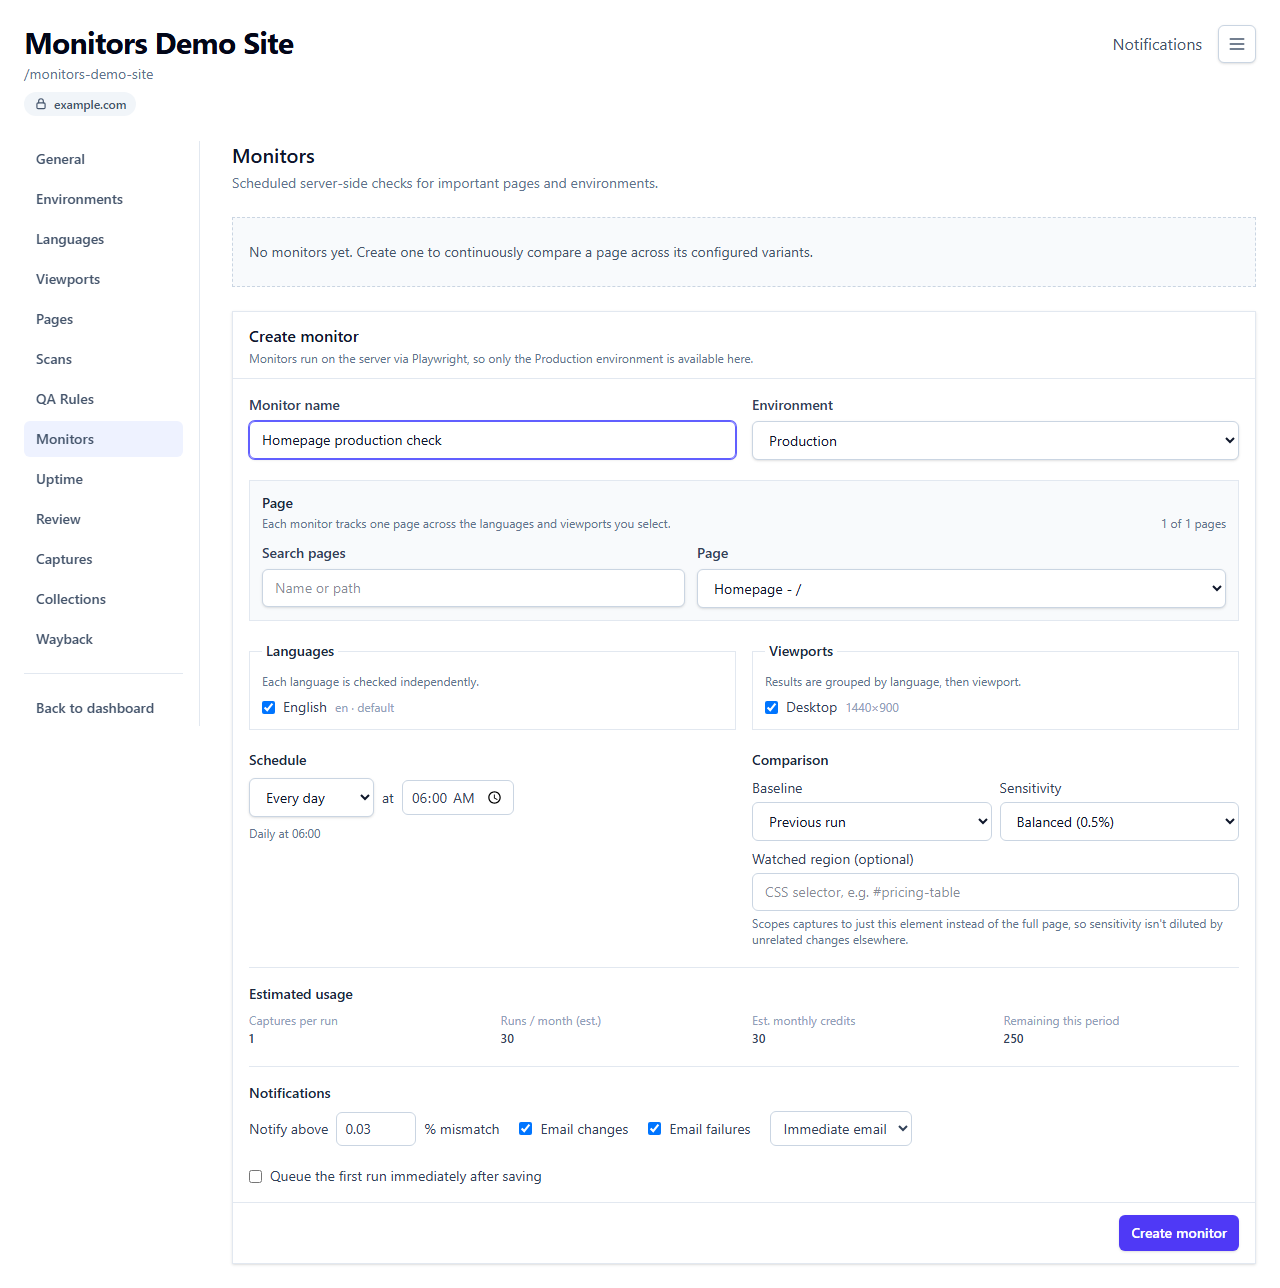
As you fill in the form, an Estimated usage panel updates live: how many screenshots one run produces, roughly how many runs per month at your chosen schedule, and the resulting monthly screenshot usage — flagging in red/amber if that would exceed your plan's per-run cap or remaining allowance.
Your plan limits how many enabled monitors a workspace can have at once (disabled/draft monitors don't count against this), and sets a minimum interval between runs — a schedule that fires too often for your plan is rejected.
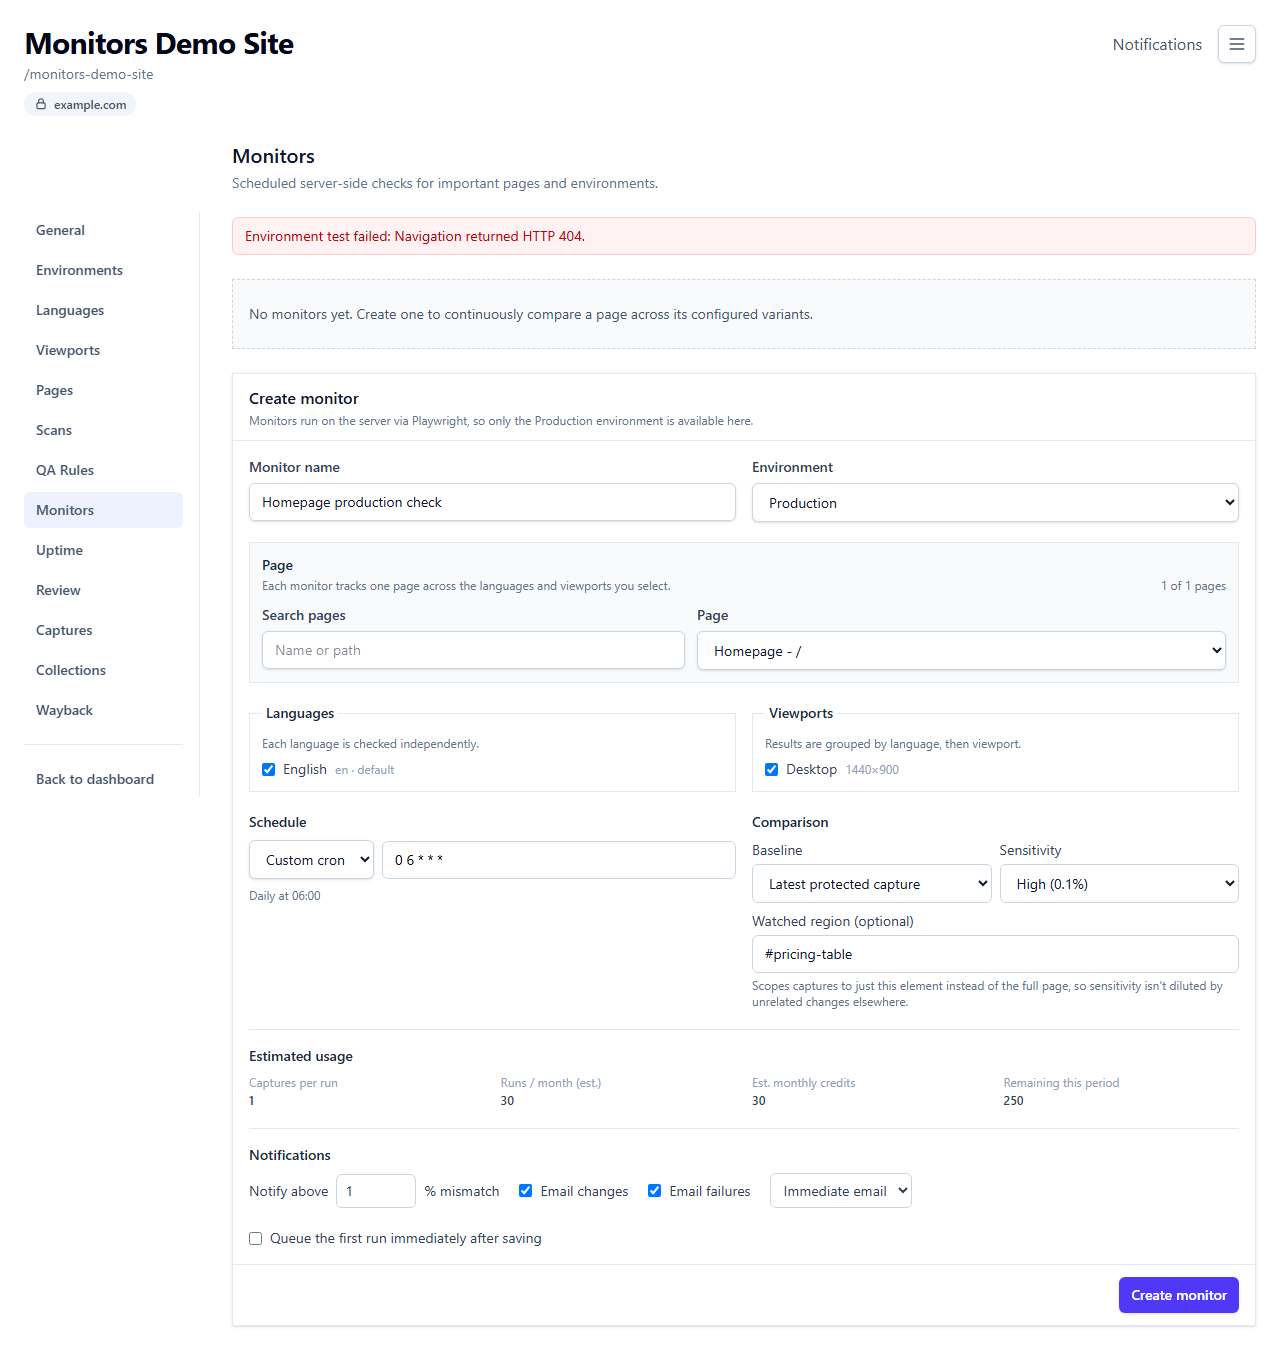
"This monitor's site may be blocking VisualRunner"
When you save an enabled monitor, VisualRunner runs a quick connectivity test against the environment first. If that test is refused with an HTTP 403 / 429, or it times out or the connection is reset, the form shows a site is blocking VisualRunner notice instead of a generic error — the target's firewall or bot-protection (Cloudflare, AWS WAF, Akamai, etc.) is rejecting our servers, which would also make every scheduled run fail. Allowlist our monitoring IP to fix it — see Allowlisting VisualRunner Traffic.
This check doesn't apply to an environment delivered by a Private Runner: those monitors run inside your own network, so VisualRunner's IP never needs to reach the site and the monitor saves and enables normally. If such a monitor's runs then capture nothing three times in a row (runner offline or unable to reach the site), VisualRunner auto-pauses it with a message pointing you at the runner.
Baselines
The baseline is the "before" screenshot each new capture is compared against.
| Baseline strategy | Behavior |
|---|---|
| Previous run | Rolls forward automatically — the baseline becomes whatever was just captured, every run, whether or not a change was detected. This is the default. |
| Latest protected capture | Uses the most recently protected/permanently-kept capture (or the most recent Wayback archive snapshot) instead of the last run. |
| Pinned (set manually) | Locked to one specific past capture, set via Set as baseline on a past result or from the comparison viewer. Stays fixed until you pick a different strategy or pin a new one. |
Once a monitor is pinned to a specific past capture, the Baseline dropdown shows it as a locked placeholder rather than letting you reselect "Previous run"/"Latest protected capture" directly — pick a different past result's "Set as baseline" action to replace it.
"Latest protected capture" with nothing protected yet
"Latest protected capture" only has something to compare against once at least one capture for this page has been protected ("Keep permanently" in Capture History) or archived via Wayback. Until then, every run shows Baseline created instead of a pass/fail result — there's nothing to diff against. When that happens, the result row explains why and offers two ways forward: Protect this capture (marks this exact capture as permanently kept, so the next run compares against it) or Set as baseline (pins this capture directly, switching the monitor to the Pinned strategy described above).
Sensitivity
Controls how big a visual difference has to be before you're notified:
| Preset | Threshold |
|---|---|
| Low | 2% mismatch |
| Balanced | 0.5% mismatch (default) |
| High | 0.1% mismatch |
| Custom | Whatever you set in "Notify above __% mismatch" |
The "Notify above" field is always visible and editable, but it's only actually used when Sensitivity is set to Custom — on Low/Balanced/High, your notification threshold is the fixed preset percentage above, not this field's value. If you're not getting notified when you expect to (or the reverse), check which preset is active first.
A change other than a pure visual diff — the page's HTTP status changing, a new redirect appearing, or the page becoming unreachable — always counts as a change regardless of the mismatch percentage.
New JS console errors
A new JavaScript error in the browser console (or an uncaught page error) notifies you right away, independent of the Sensitivity setting above — even if nothing visibly moved on the page. This only covers genuinely new errors: the same error showing up again on a later run (even with a different line number or request id) won't notify you a second time.
If a page has a console error you already know about and don't want to be notified about, add an Ignore console message rule for it under QA Rules — once ignored, it's suppressed everywhere, including here, not just in QA Rules' own results.
Ignoring known-noisy regions
If part of a page changes constantly for reasons you don't care about (a rotating banner, a live visitor counter), you can ignore that region so it stops triggering notifications. This is done from the comparison viewer after a run — select the noisy region on a detected change and choose "ignore this region," not from the monitor's own settings screen. An ignore rule can be scoped to just this monitor, to the page (so it applies across every monitor watching that page), or to the whole project.
Schedule
Pick Hourly, Daily, Weekly, or enter a custom cron expression directly. Runs are automatically spread out by a few minutes per monitor so a large batch scheduled for the same time (e.g. every monitor set to "daily at midnight") doesn't all fire in the same instant.
Running a monitor outside its schedule
- Run now — triggers an immediate run without waiting for the schedule, and without needing the monitor to be enabled.
- Run missing baselines — runs only the language/viewport combinations that don't have a baseline yet (e.g. after adding a new language), instead of recapturing everything.
A monitor only ever has one run active at a time. Triggering a new run while one is already in progress queues a single follow-up run rather than starting a second one in parallel or being lost.
Triggering a monitor from CI
On a Business (or Enterprise) plan, each monitor also has a Copy CI command button — it copies
a ready-to-run curl command that triggers this monitor's next run from a CI pipeline, using an
API key instead of your login session. See API Access for setting up a
key and, optionally, sending results to Slack or Microsoft Teams. The button only appears on
workspaces whose plan includes API access.
Reading monitor status
| Status shown | Meaning |
|---|---|
| Enabled | Running on schedule. |
| Paused | Not running — either you disabled it, or it disabled itself. When it disabled itself, a short explanation now appears directly under the monitor (e.g. "no assigned pages," "exceeds this plan's limit," or "domain is not active on the current plan") — no need to guess. |
| N recent failures | The monitor's last few runs failed to complete (e.g. the page was unreachable), shown alongside the exact count it escalates at (e.g. "2 recent failures — escalates at 3"). Reaching that count sends an additional escalation notification and turns the badge red. |
| N watched pages missing | One or more pages this monitor watches were marked missing by a recent Scan (its target URL is no longer found). The monitor still runs, but a run against a missing page usually fails — check the Pages tab for what happened to it. |
Monitor Health Dashboard
For a workspace-wide view instead of one project at a time, open Monitor health from the main dashboard sidebar. It shows Healthy/Disabled/Escalated tiles and a flat list of every monitor across every project you can see, each linking back to its project's Monitors tab — the customer-facing counterpart to spot-checking each project individually.